Aesthetics: Handling Caveats When Mapping Variables
Aesthetic mappings are powerful — but they can sometimes produce unexpected results. In this session, we’ll explore common pitfalls that trip up even experienced users — from missing legends to confusing lines or plots that just don’t “look right.”
You’ll learn to spot, understand, and fix these issues — so you can debug your plots with confidence and avoid frustration down the line.
🚩 What Could Possibly Go Wrong...
(Famous Last Words)
This session builds directly on Aesthetics: Fundamentals. There, you learned how to map data to visual properties like color, shape, and size. Now, it’s time to look at the flip side: when those mappings don’t behave as expected or are causing errors.
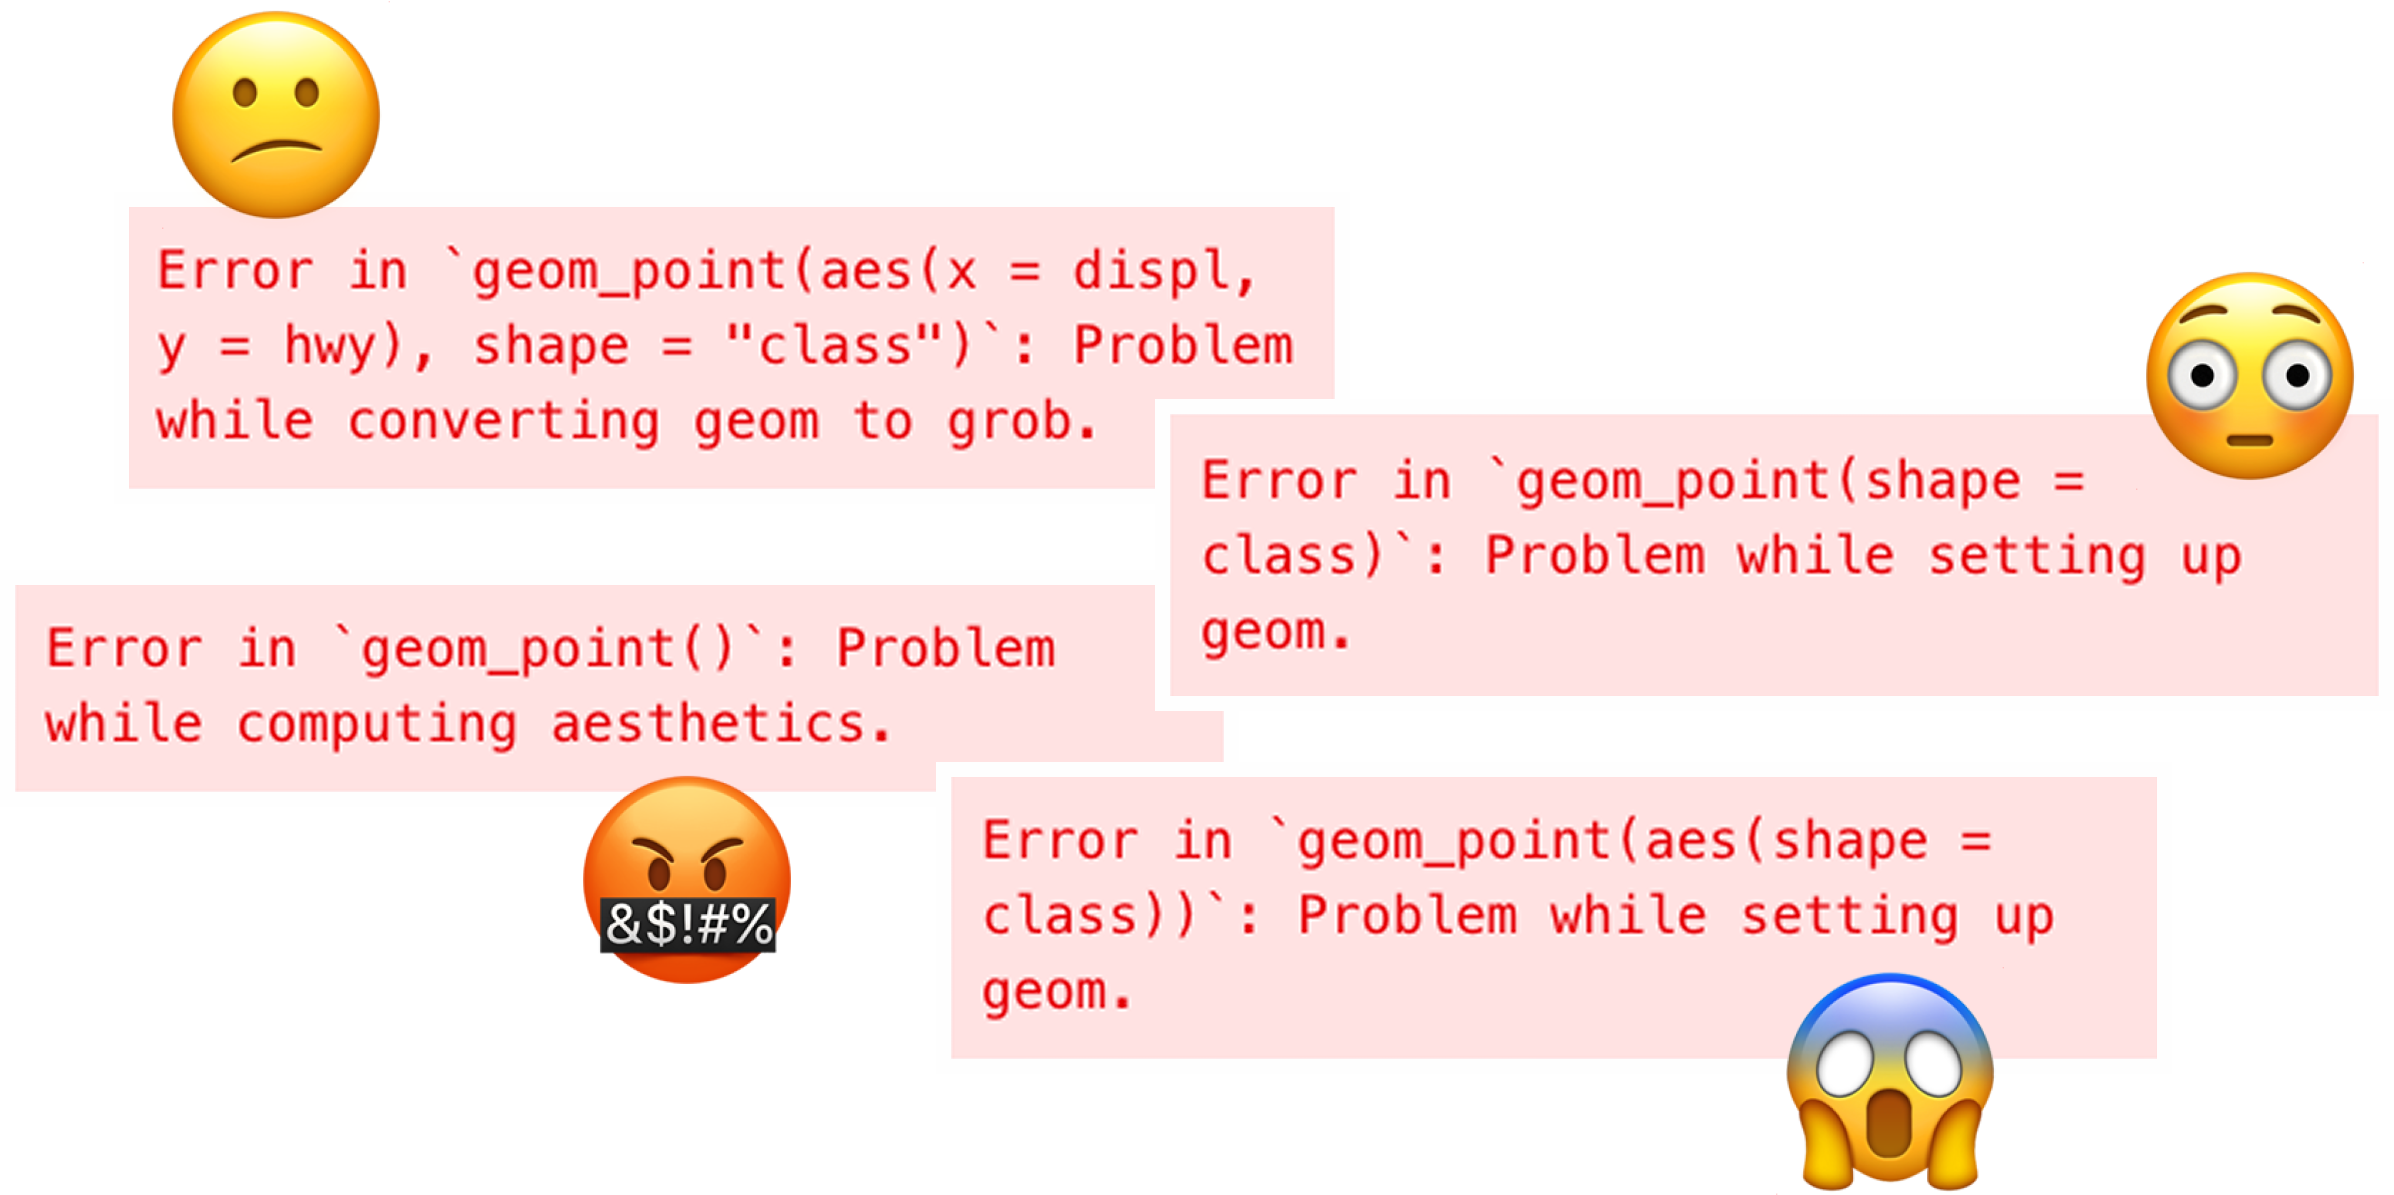
Most issues arise when the input is technically valid — but not quite what ggplot2 needs to draw the plot you had in mind.
Maybe you used the wrong data type, picked an unsuitable aesthetic, or forgot to provide grouping information for lines or areas.
In other cases, the code runs — but the logic doesn’t hold. If a constant is mapped like a variable, or a column is placed outside aes(), you might end up with odd legends, blank plots, or unhelpful errors.
These aren’t obscure bugs — they’re everyday mistakes. And once you learn what they look like, you’ll be able to spot and fix them quickly — keeping your plotting flow smooth and frustration-free.
Ready to enroll? 🚀
Enroll now to unlock instant, lifetime access to every lesson, and become the ggplot2 expert your company needs!
Already enrolled? Login