Publish Your Work: How to Share Your ggplot2 Graphic
At the end of this course you'll build great charts with ggplot2. But their impact stays limited if they never leave your local machine.
This lesson shows how to package, store, and share your work in a way that is safe, reproducible, and easy for others to read and reuse.
🧐 The Problem
After going through this course, you’ve probably built a solid foundation in data visualization and ggplot2, and even created some nice graphs along the way.
But those graphs aren’t very useful sitting alone on your laptop. It’s time to think about sharing them with the world.
Maybe you want to include your charts in a larger document in your company, use them in a scientific publication, share them on social media, or add them to slides for a presentation.
Whatever the case, you need a way to build, store, and share your work that meets a few key requirements:
- Safe — your code is stored on the cloud so you never lose it.
- Transparent — your code and methods can be inspected and verified by others.
- Reproducible — you, and anyone else, can reuse your code easily to adjust them to similar use cases or run it with the latest data.
- Clean — your project is easy for readers to understand and looks professional.
🚀 The Solution
1️⃣ Quarto for Reports
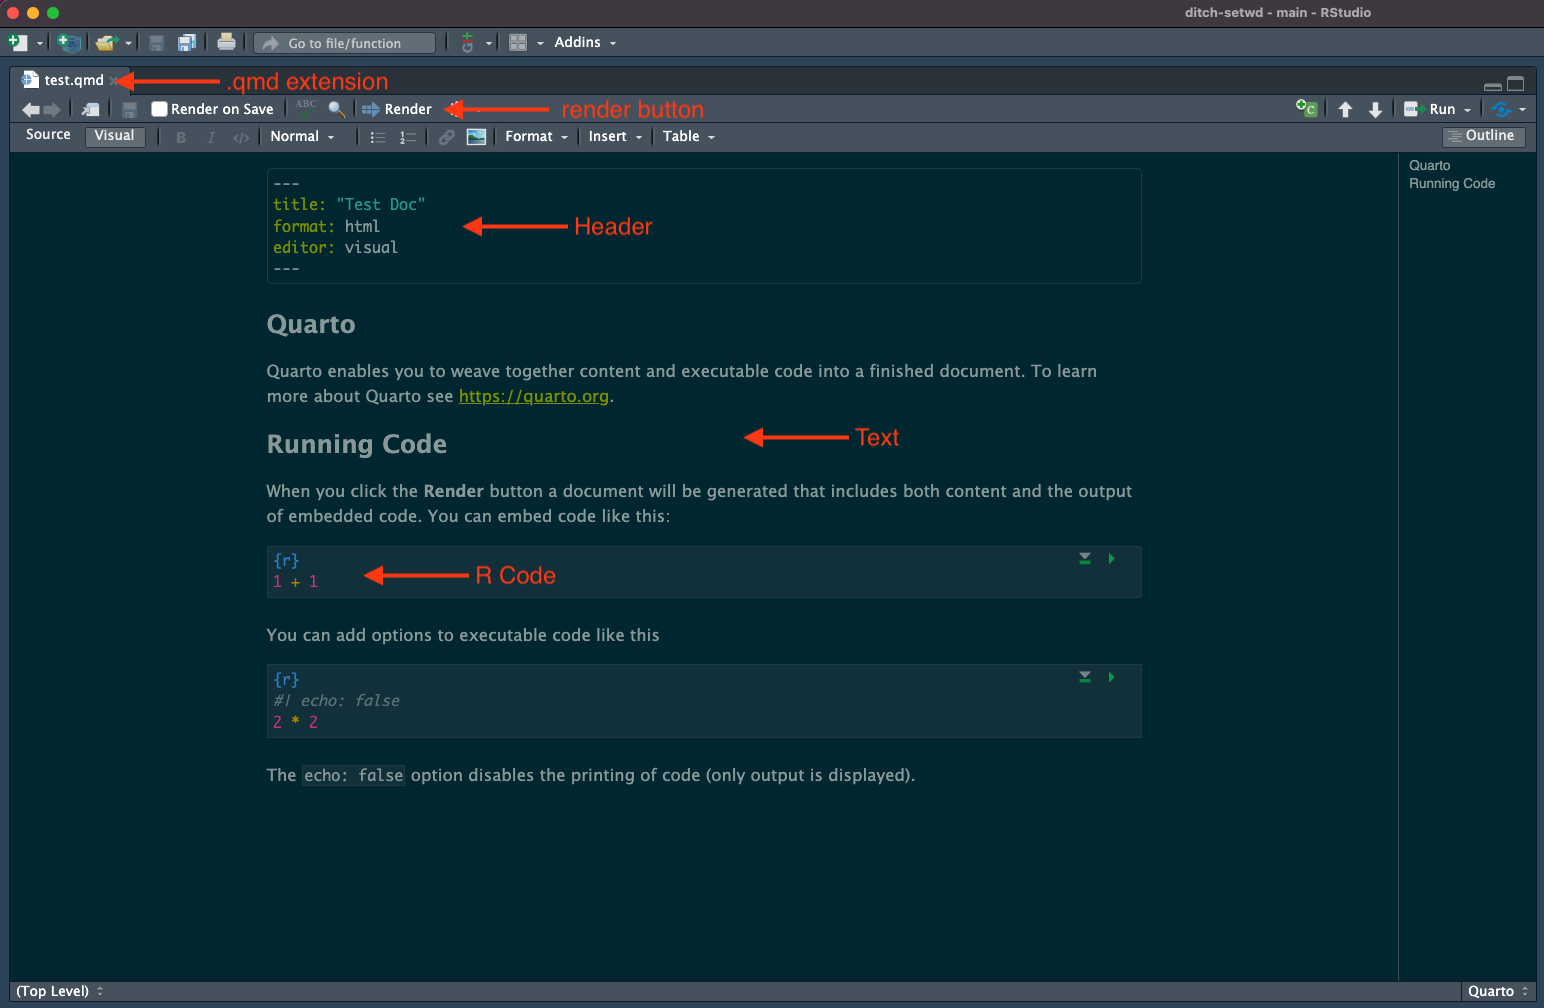
The first tool we recommend is Quarto.
It brings your R or Python code, explanations, and results together in one clean, reproducible document.
You write a .qmd file like the one below, click run, and Quarto produces a polished report with your analysis.
It is incredibly quick to learn. Yan has written a short guide that walks you through the steps in under 3 minutes. If you want to level up and create standout reports, he has also compiled a solid collection of tips and tricks.
2️⃣ Git and GitHub for Storage and Version Control
Git helps you track every change in your project.
Each time you reach a good stopping point, you create a commit. These commits act like checkpoints, so you can return to any earlier state whenever you need.
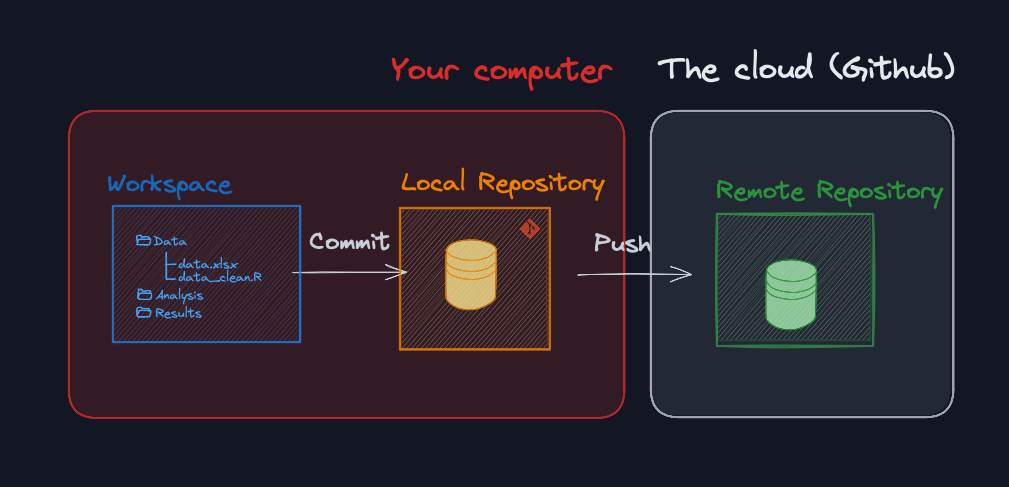
Then GitHub works hand in hand with Git.
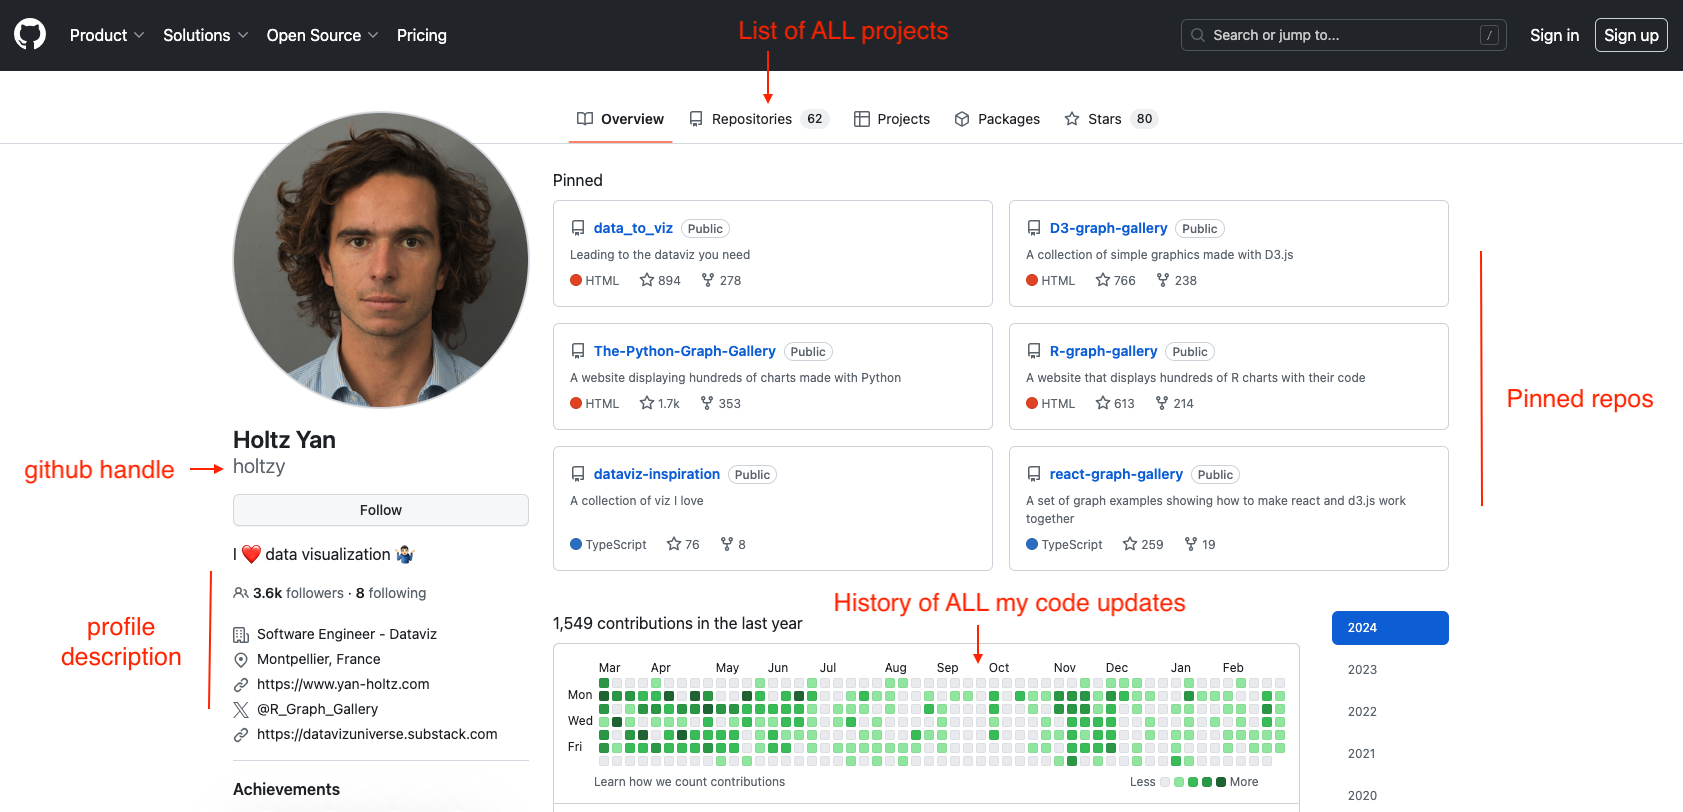
Github is a website where you store your code, keep it safe, and make your commit history easy to browse. Others can read your work, open issues, leave comments, and collaborate.
It is not only practical, it is also a core element of your identity as a developer and a real asset on the job market. Here is what a GitHub profile looks like:
Git and GitHub can do a lot, and the range of features can feel overwhelming when you start.
The good news is that you only need a small portion of these features to cover almost everything you will do: track your changes and store your code safely online.
3️⃣ Make It Public
Once your Quarto report is on GitHub, you are only one click away from turning it into a public website . It is incredibly convenient: instead of sending email updates to collaborators, share the URL and they will always see the latest version.
If you want to learn how to do it, I walk through the process in this tutorial.
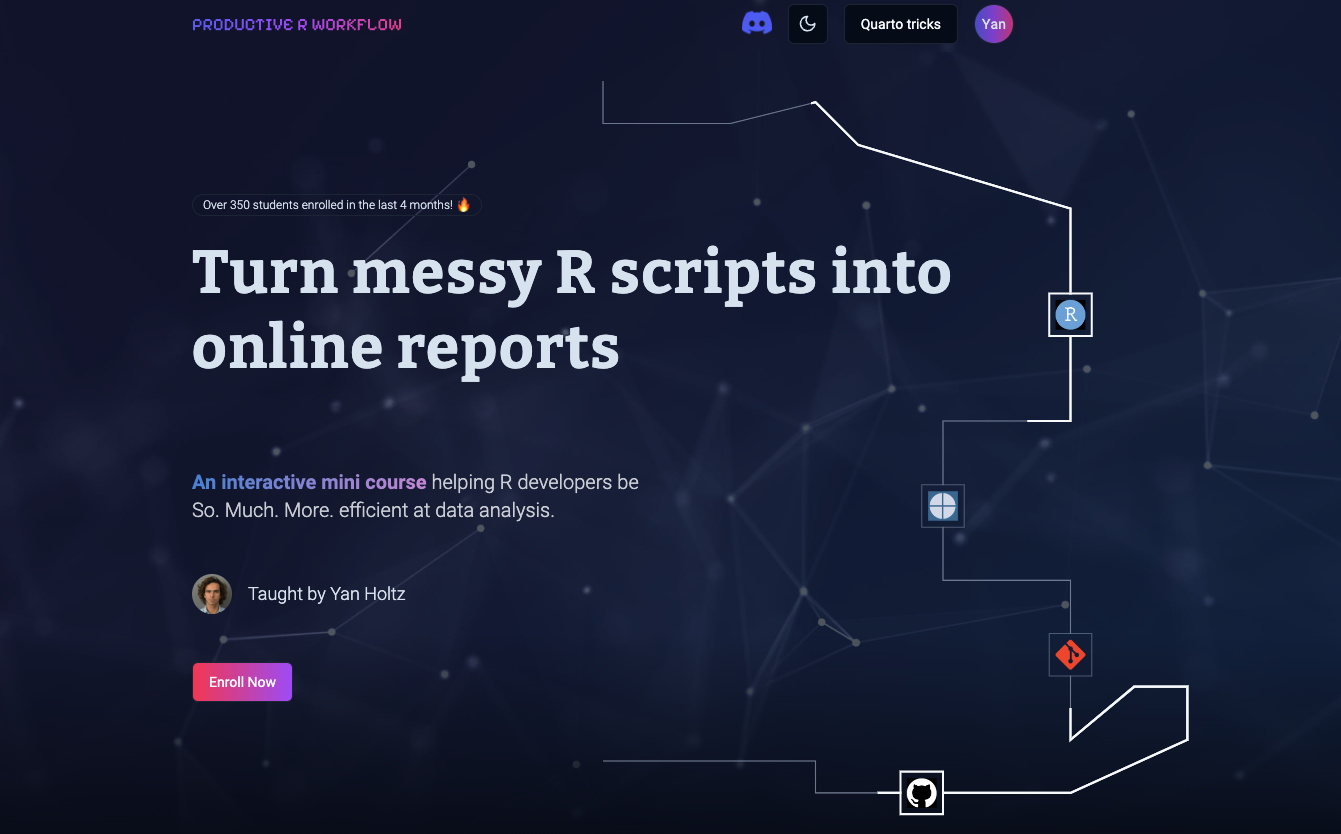
yan.holtz.data@gmail.comIf you want to write cleaner code, create polished reports, and master the essentials of GitHub, take a look at Yan's other course: Productive R Workflow. It covers exactly that.
👣 Last Step?
Ready to put this into practice? Take your latest graph, wrap it in a report, upload it to GitHub, and share it with us on the #share-your-viz channel or on social media.
We will do everything we can to help you refine it and boost its visibility.
One more idea: gather all your projects in a clean portfolio. For inspiration, here are the portfolios of Cédric and Yan.
We, and the world, are looking forward to seeing your work! 👋
Ready to enroll? 🚀
Enroll now to unlock instant, lifetime access to every lesson, and become the ggplot2 expert your company needs!
Already enrolled? Login