Working on Your Own R Project
This course lets you run R code directly in our sandboxes. But in real life, you’ll need to work with R in your own setup to analyze data and create your own graphs.
This bonus lesson shows how to work efficiently with R: using an IDE, writing scripts, loading data, and visualizing results without drowning in a messy workspace. By the end, you’ll have the skills to start your own projects with confidence and reproducibility.
🤔 What's an IDE
The previous bonus lesson taught you the very basic of R. It is basically a big calculator where you can run code like 1+1 to get 2.
R is very powerful, but not very convenient to use as-is. To make the experience better, we usually use an IDE: an Integrated Development Environment .
Think of it as your project cockpit! A single place to write code, explore data, manage files, and keep everything organized and accessible.
🖥️ Choosing an IDE
Several IDEs are available, and here are your 3 main options:
🔥 Don’t feel like comparing? Just choose RStudio — you can’t go wrong.
🔎 Anatomy of an IDE
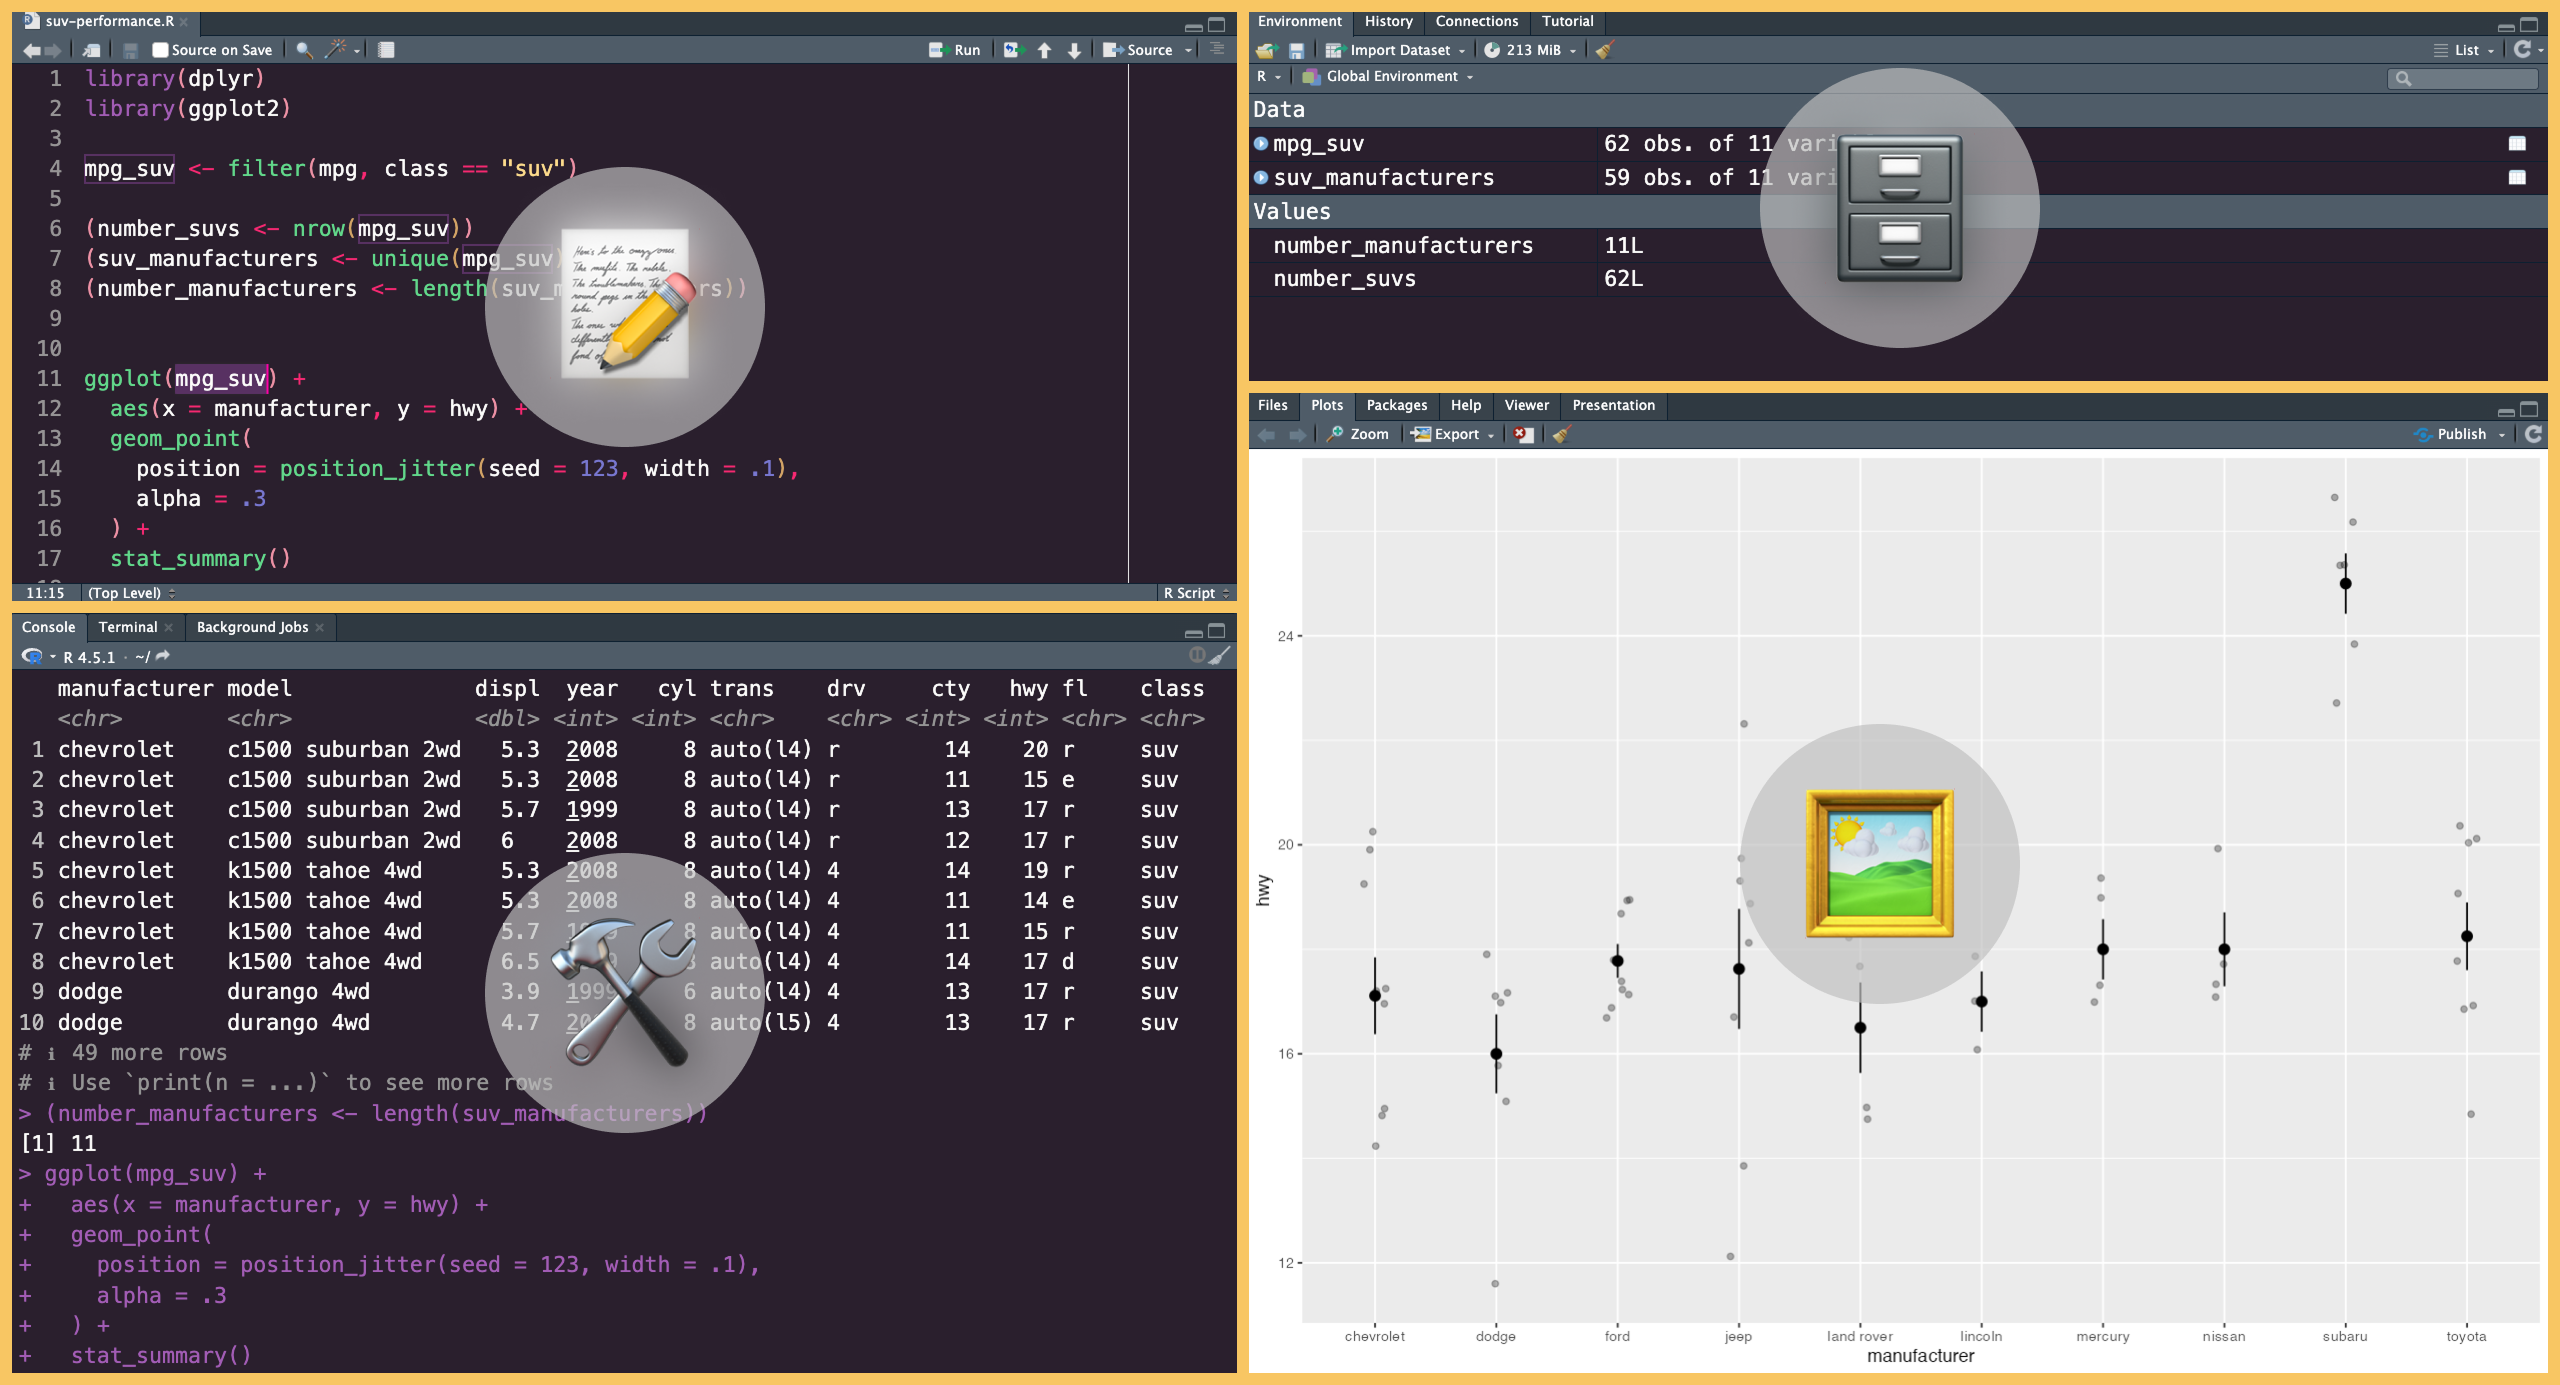
When you open RStudio or Positron, you’ll see 4 sections (called "panes"). Their contents vary a bit, but they can generally be grouped as:
- 📝 Script Editor (top–left)
Write and edit your scripts or notebook documents here. - 🛠️ Console, Terminal, and More (bottom–left)
Execute code from the editor and view the results in the console, or run shell commands directly in the terminal. - 🗄 Environment, Connections, and More (top–right)
Track objects, functions, and database connections. In RStudio, this pane also includes history, version control, and more. In Positron, you’ll also find Help and the Viewer here. - 🖼️ Plots and More (bottom–right)
Preview your plots and other graphical outputs. In RStudio, this pane is also used to inspect files, view HTML and other results, or consult Help pages.
Each panel can be resized or rearranged. In Positron and VS Code, you’ll also find top and side bars that give quick access to files, projects, search, extensions, and other tools.
🎮 Take some time to get comfortable with your IDE!
Every small shortcut or trick you learn saves a few seconds, which adds up to a huge time saver in the long run.
Ready to enroll? 🚀
Enroll now to unlock instant, lifetime access to every lesson, and become the ggplot2 expert your company needs!
Already enrolled? Login